
CHILD DEVELOPMENT REPORT For The 2022-2023 School Year
From the Director of Child Development

Director of Child Development
Development and learning take place within a rich tapestry of social and cultural contexts. These include families, cultures, languages, and communities. Here at the Institute of Community Services, we strive continuously to strengthen child and family relationships and outcomes. We understand how important it is for families to be engaged with their children. We include parents in every facet of learning. Our teachers provide enrollees with a safe, nurturing, responsive environment that invites learning.
Classrooms are set up to meet their needs with appropriate furnishings and materials. The space is modified If there are special physical needs. We provide opportunities for mental, physical, social-emotional and cognitive growth. This is done through creative experiences and play. We use research-validated curriculums - - Learn Every Day, Mississippi Beginnings, and OWL. All of these curriculums are thematic-based, require critical thinking, and help children learn first-hand about the world we live in. Children are engaged and eager learners from birth. Our teachers build on children’s readiness and assessment data, and parental input to implement intentional, effective learning environments and educational experiences that lead to stronger child outcomes and school readiness.
We are also helping our children to become social-emotional competent through creating a compassionate school-family culture which motivates adults and children’s willingness to engage in healthy relationships. Our response to conflict and upgrading social-emotional skills boosts adult and children’s ability to adapt to changing situation and promotes resiliency.
We also use research-based assessments LAP-BK, Brigance, STAR and children portfolios. Data from these sources, and parental input, help us provide strategies, interventions and support to help children to be ready for school and beyond.
ELC COLLABORATIVES & NUMBER OF CLASSROOMS
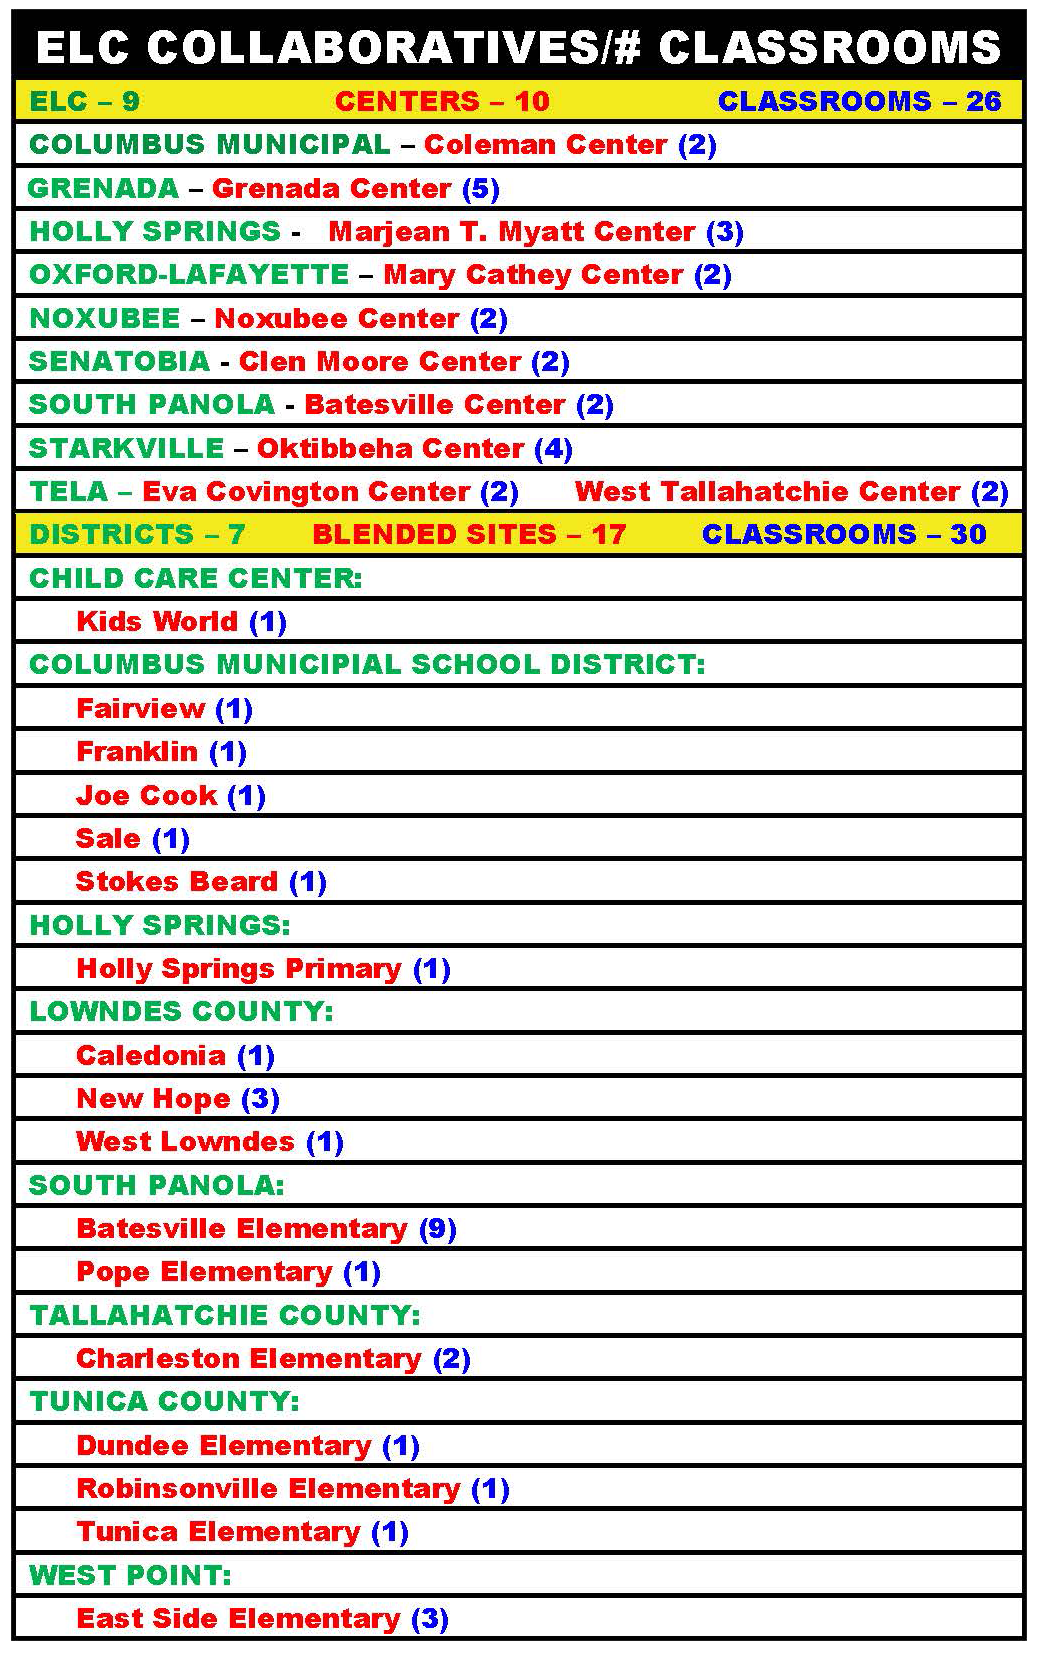
We are involved in collaborative relationships with other ELCs and organizations that provide similar services to young children and their families. Our combined efforts provide opportunities that each of us alone could not provide.


Alignment of ICS School Readiness Goals with Head Start Early Learning Outcomes Framework (HSELOF) & Achievement Utilizing the Learning Accomplishment Profile-3 (LAP-BK)
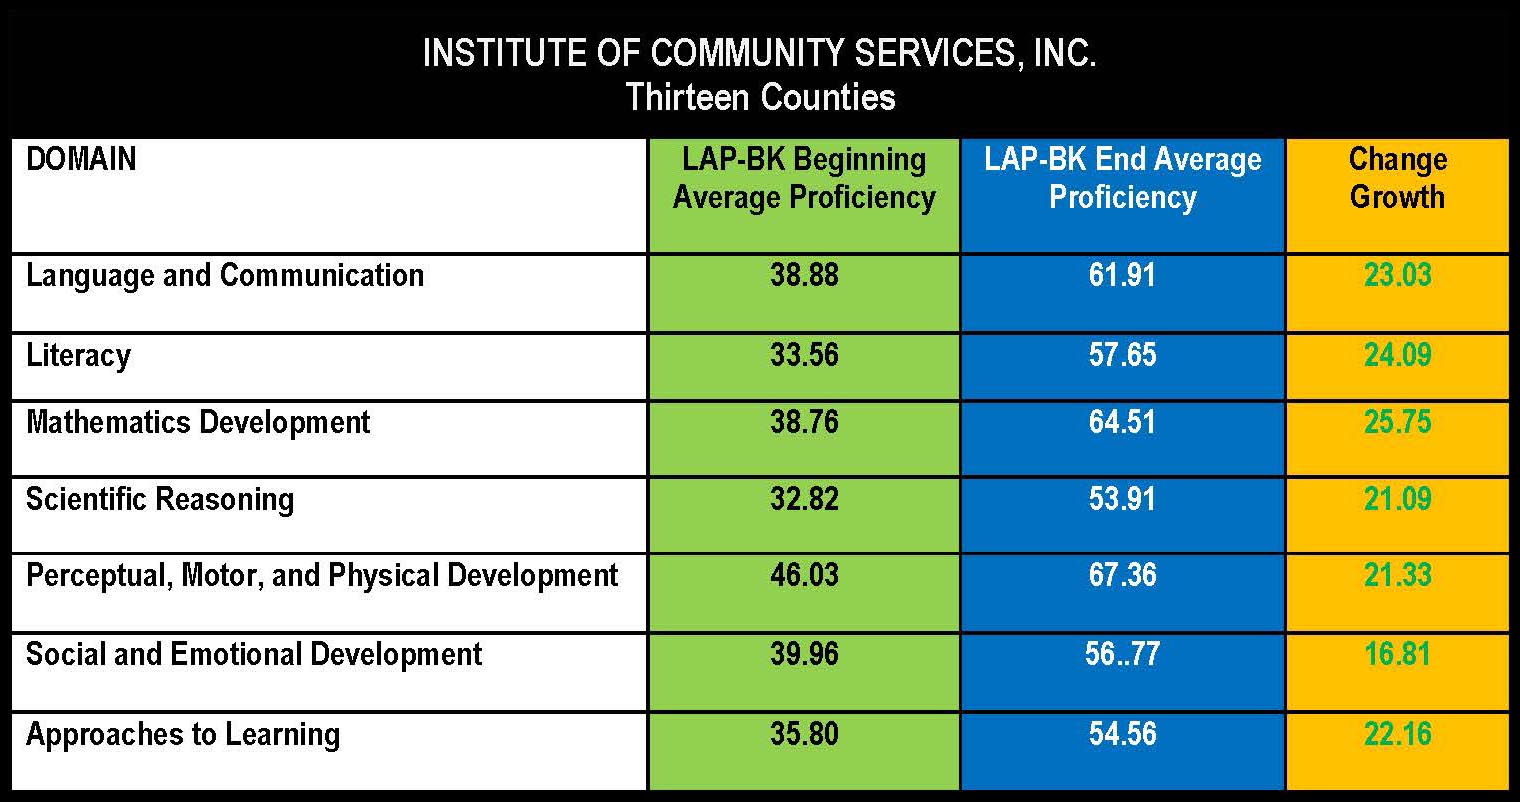
Click HERE to view the full table.
(Table opens in a new window)

5630 Pre-K CLASS Average Score Charts
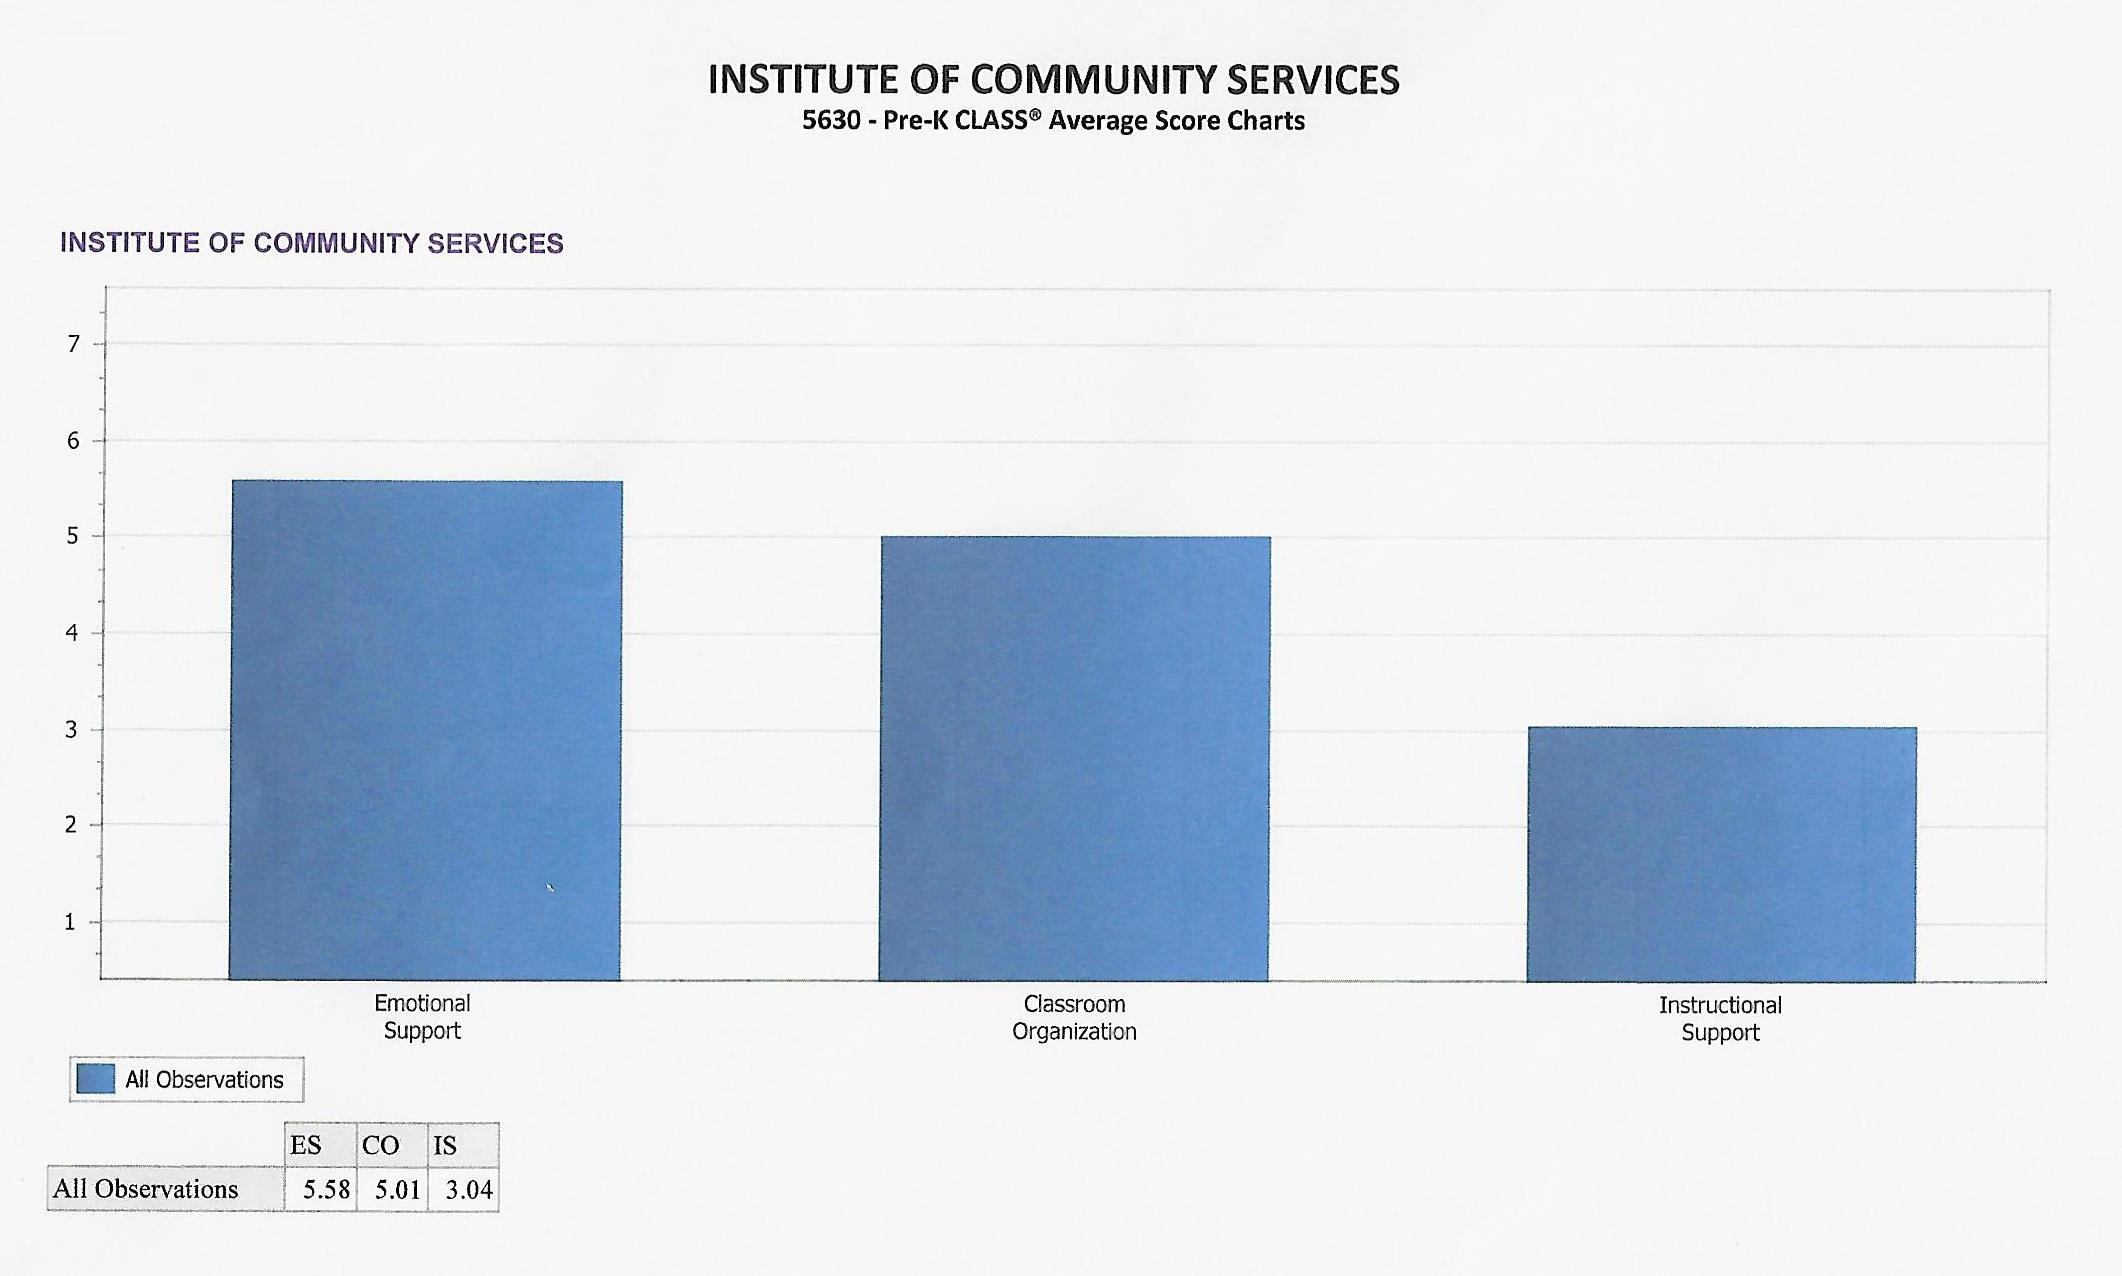
CLASS Pre-K® Domains and Dimensions:
Emotional Support ES)
- Positive
- Negative Climate
- Teacher Sensitivity
- Regard for Student Perspectives
Classroom Organization (CO)
- Behavior Management
- Productivity
- Instructional Learning Formats
Instructional Support (IS)
- Concept Development
- Quality of Feedback
- Language Modeling
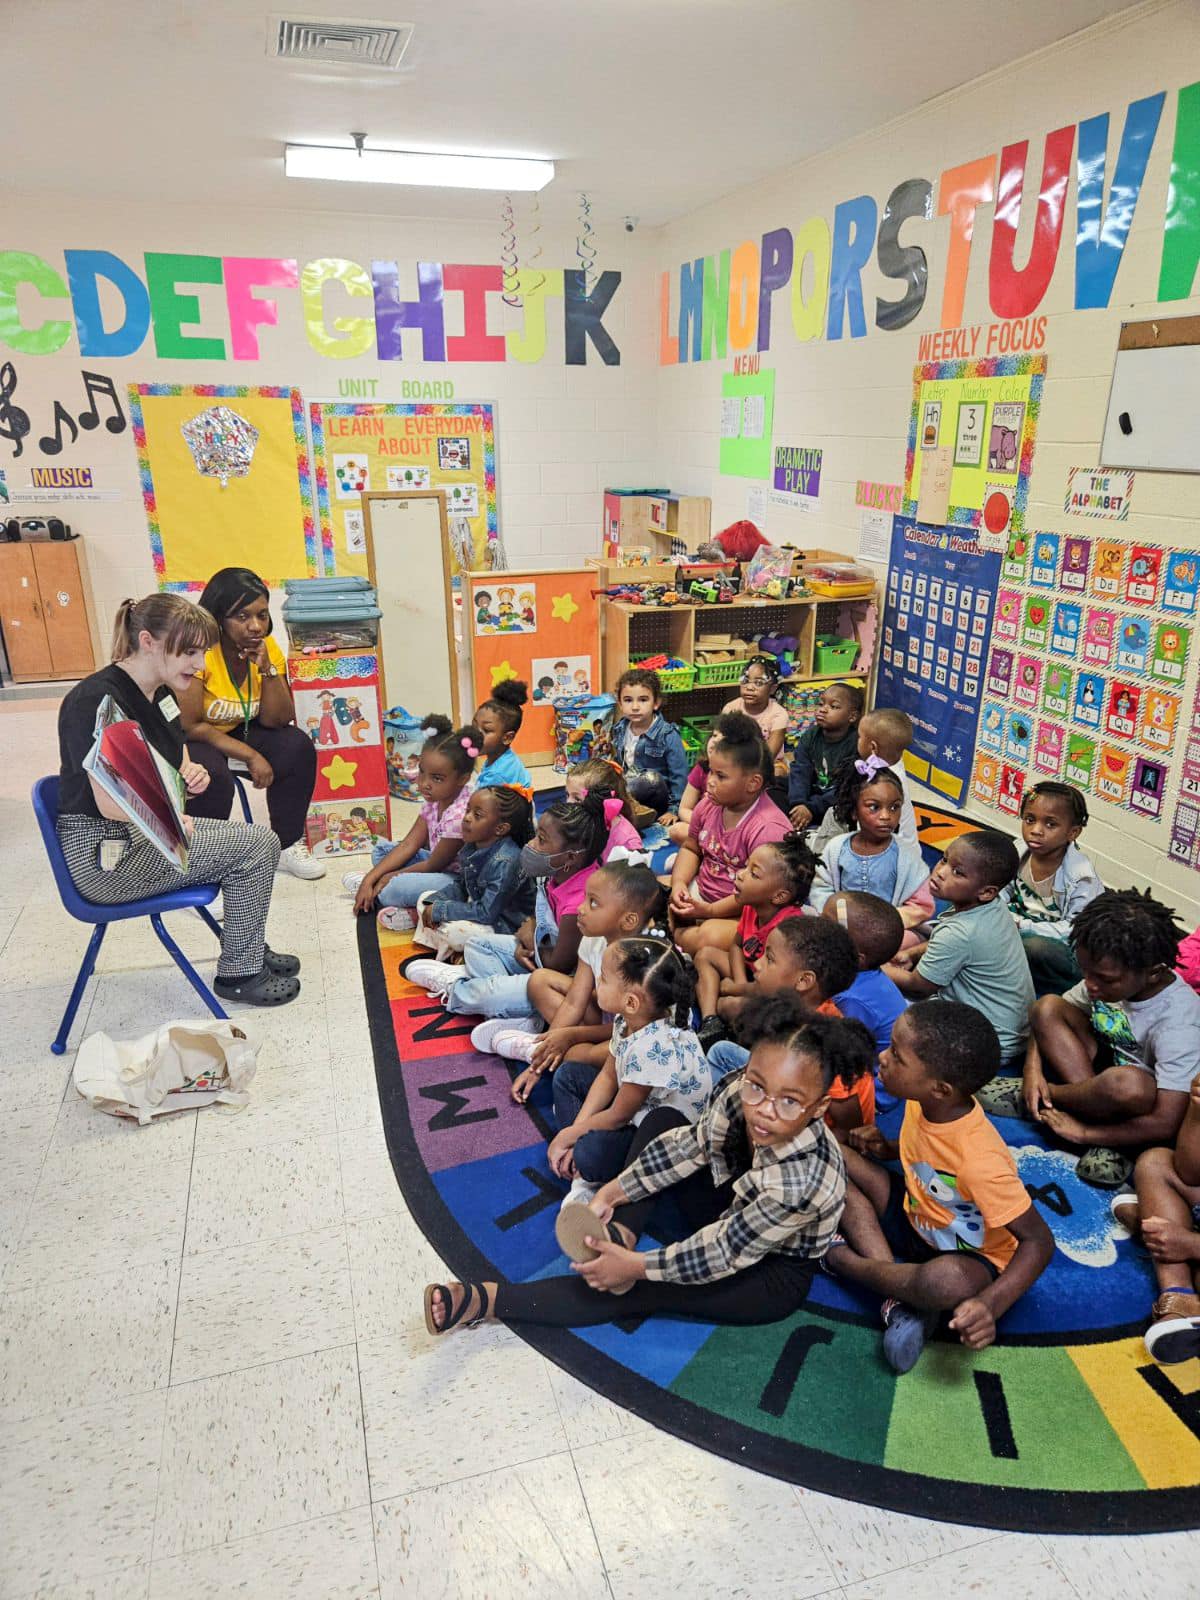
Learn more about the CLASS assessment tool and its use in Head Start classrooms.

FAMILY SERVICES & ERSEA REPORT for the 2022-2023 School Year
Total Funded Enrollment 3,300
Total Number of Children Served 3,122
Total Number of Families Served 2,918
Year's Total Wait-List Numbers 828
Age Eligible Wait-List Children Not Served 27%
Average Monthly Enrollment (ADA) as Percentage of Enrollment 82.16%
COMMUNITY ASSESSMENT DATA
- Age Eligible Children Served 92%
- Percentage of Income Eligible Pre-School Children 83%
A Snapshot View of our Head Start Families

2022-2023 HEALTH AND NUTRITION REPORT

Physical Exams
Of the 3,084 children enrolled:
99% received Medical Examinations, a slight increase from last year 97.3%
During the year, 3079 Physical Exam were completed, 207 with concerns, 1.4% refusals. There were 1.2 % of children with respiratory distress during the school year.

Chronic Health Conditions
207 were diagnosed with chronic health conditions; however, less than 7% of the children who had chronic health condition showed a need for medical treatment.
Asthma: 37 children 1.2%
Seizures: 11 children <1%
Hearing Problems: 3 children <1%
Vision Problems: 80 children 3%
High Lead Levels: 5 children <1%
Diabetes: 0 children 0%
Dental Exams
Of the 3,084 children enrolled:
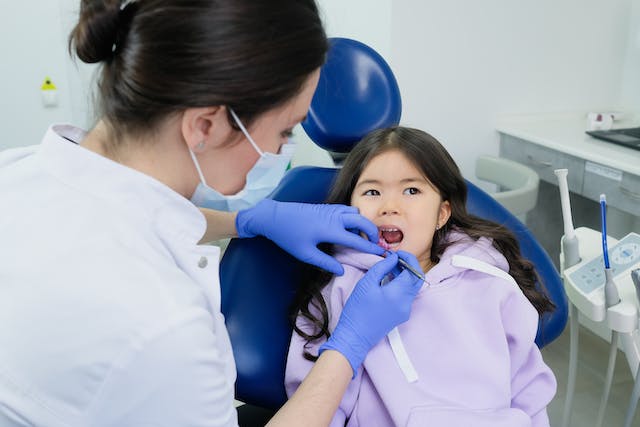
99% received Dental Examinations with a slight increase from last year 99.8% (3066 Dental Exams were completed, 297 failures and 14 dental exam refusals.)
7% of the children needed dental treatment and of these 5% received dental treatment. Less than 1% of treatment was not received due to parents not keeping/making appointments, children leaving the program before their appointment dates, or appointments scheduled for future dates. Parents were encouraged to follow up when possible during the summer.
Immunizations
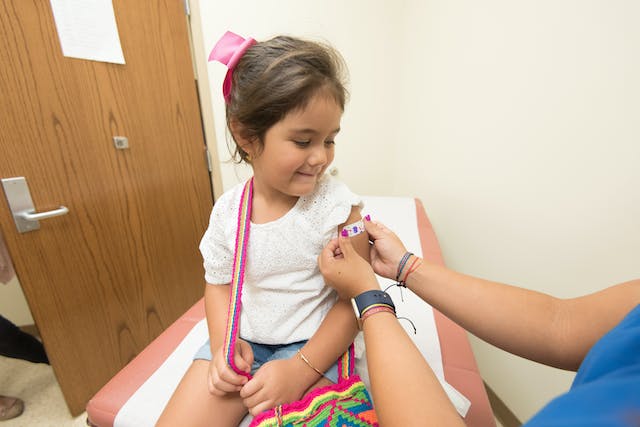
99.9% of the children were up-to-date on immunization and less than 1% were exempt.

Health Insurance
98% of children had Health Insurance at enrollment. 99% of the ICS Children had Health Insurance at the end of enrollment. 1% of the children were without health insurance at the end of the school year after staff worked with parents.
87.9% of the children had Medicaid/CHIP at the beginning of the school year. At the end of enrollment 88%, a slight increase.
10% of children had private health insurance at the beginning of enrollment and 11% of the children had private health insurance at the end. A slight increase by 1%.
100% of the children/families had Medical Homes when staff began working with them (at enrollment and end of enrollment).
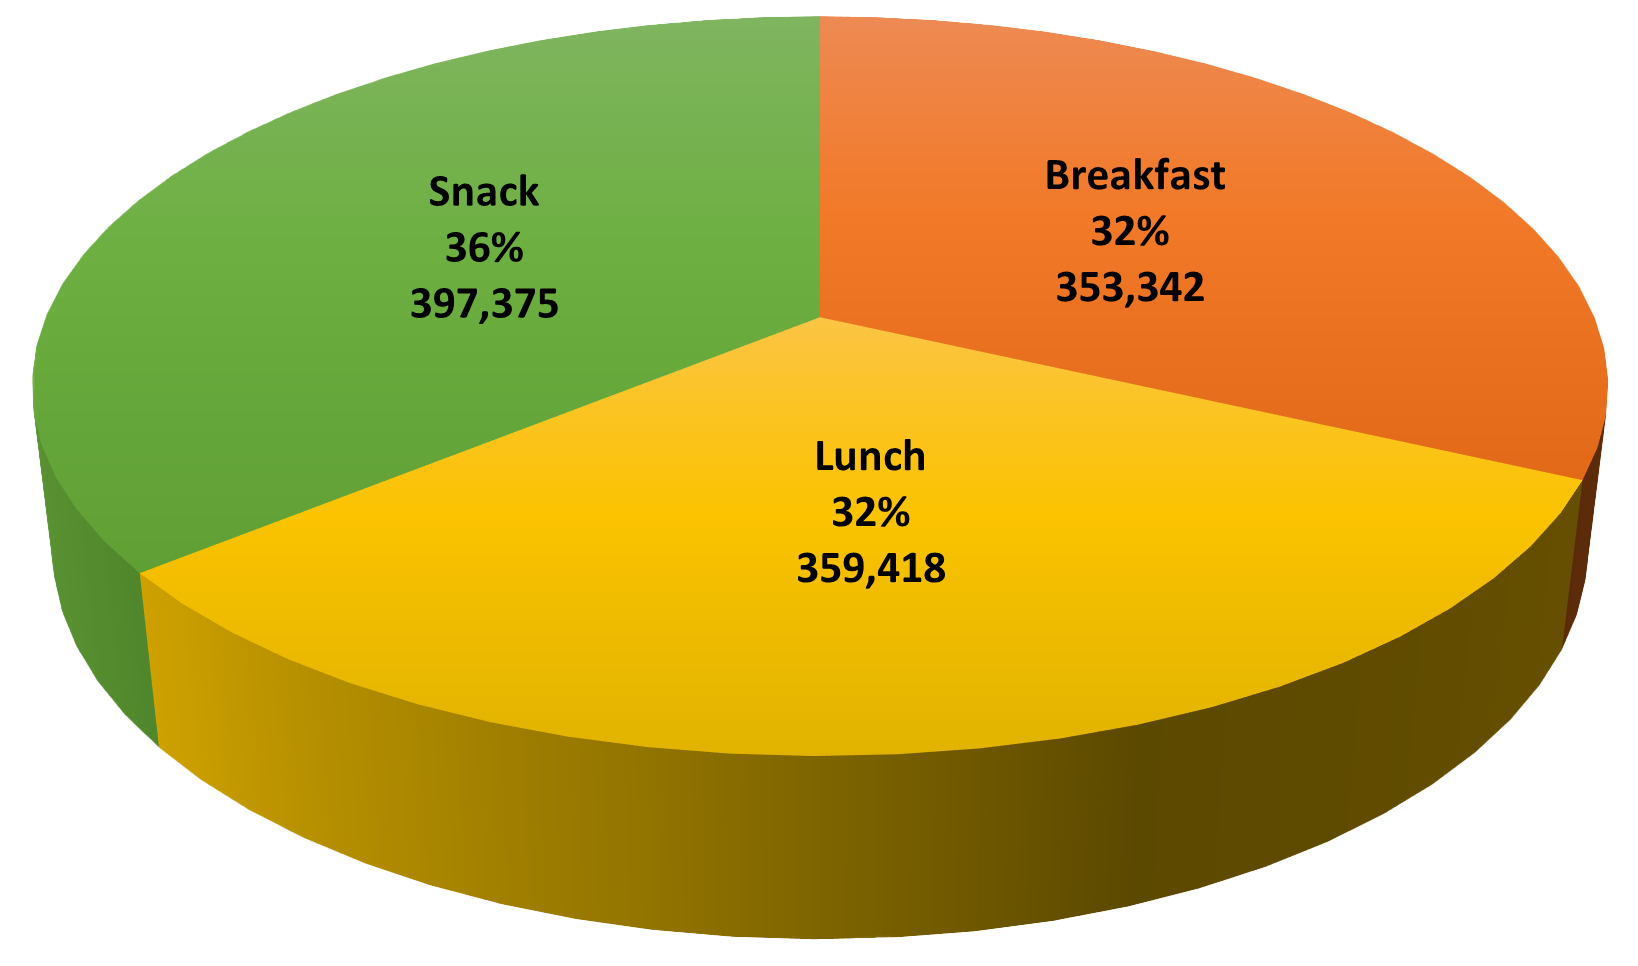
NUTRITION - Total Meals Served - 2022-2023

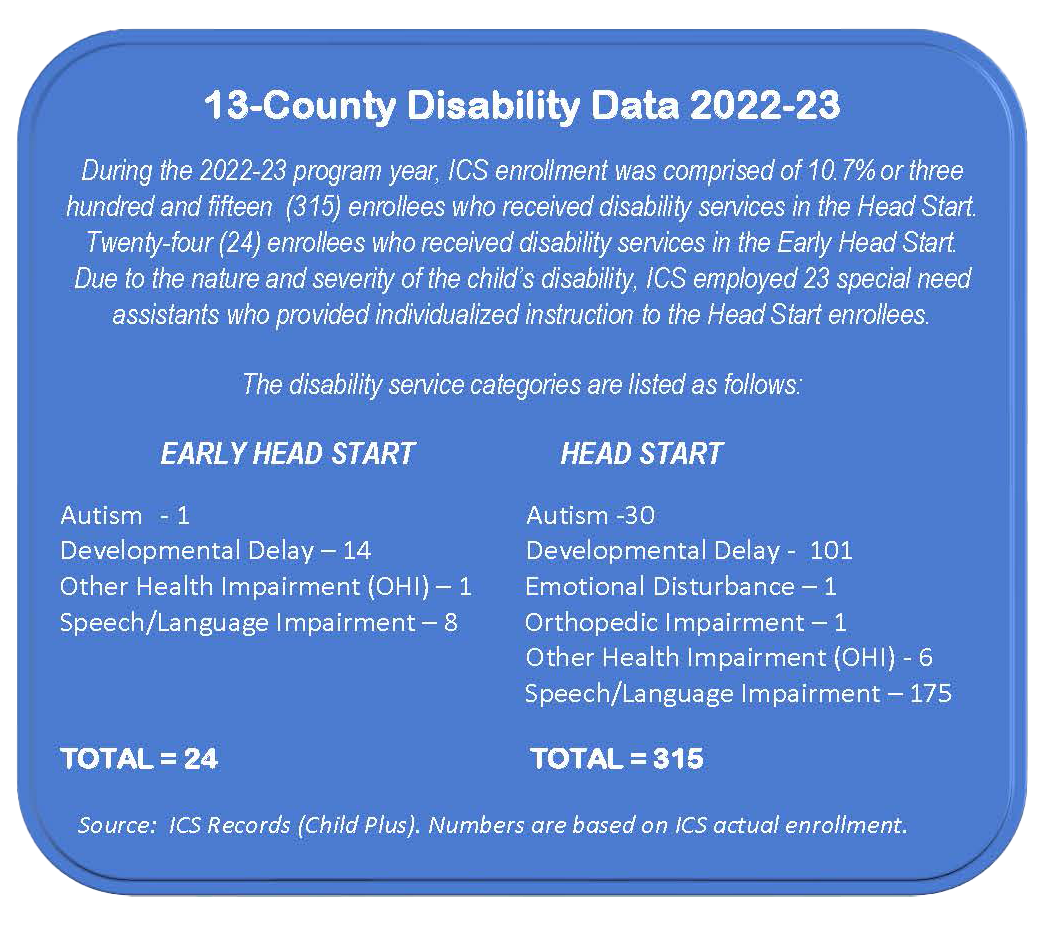
13-COUNTY DISABILITY DATA 2022-2023

2022-2023 PARENT ENGAGEMENT REPORT
Parent Engagement strives to improve family well-being by building positive interactions with communities, children, and families. Parents' active participation is crucial to our Early Head Start and Head Start programs.
Parents are the core of Head Start. Parents have many significant chances to participate in program policies, decision-making, and leadership development. ICS builds strong, goal-oriented relationships with families aimed at providing them the resources they need to advocate for their own education and well-being and their children's success throughout life.
Parents are encouraged to participate in local and state activities that help their children thrive. ICS recognizes parents as their child's first teacher. Our researched parent curriculum Systematic Training for Effective Parents Under Six (STEP) and Nurturing Father Program promotes school and home parental involvement. Research shows that children do better when they are interested in learning and well-being beyond the classroom. In response, we provide parent workshops, training, Policy Council meetings, bi-monthly meetings, parent volunteer opportunities, financial literacy, and other events.
Fatherhood and Male Involvement
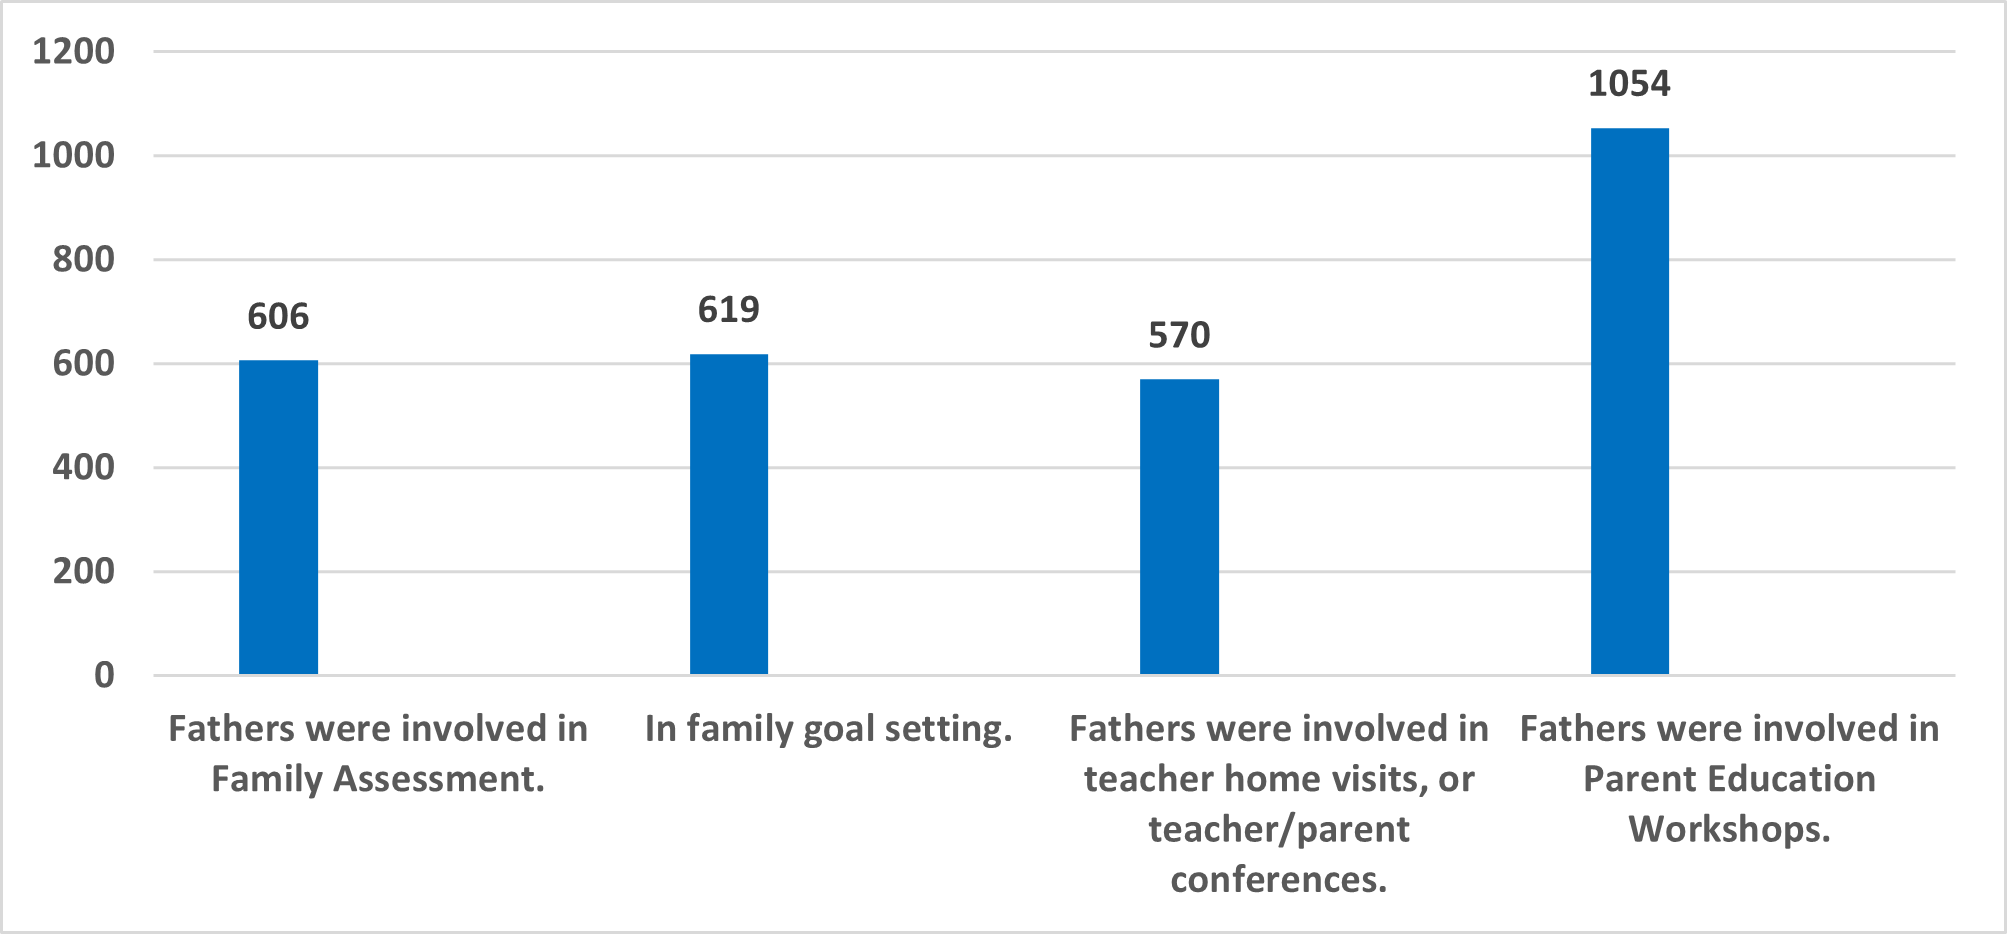
• 63 Father-Headed, Single Parent families and
• 633 Two-Parent Different sex families for a total of 696.
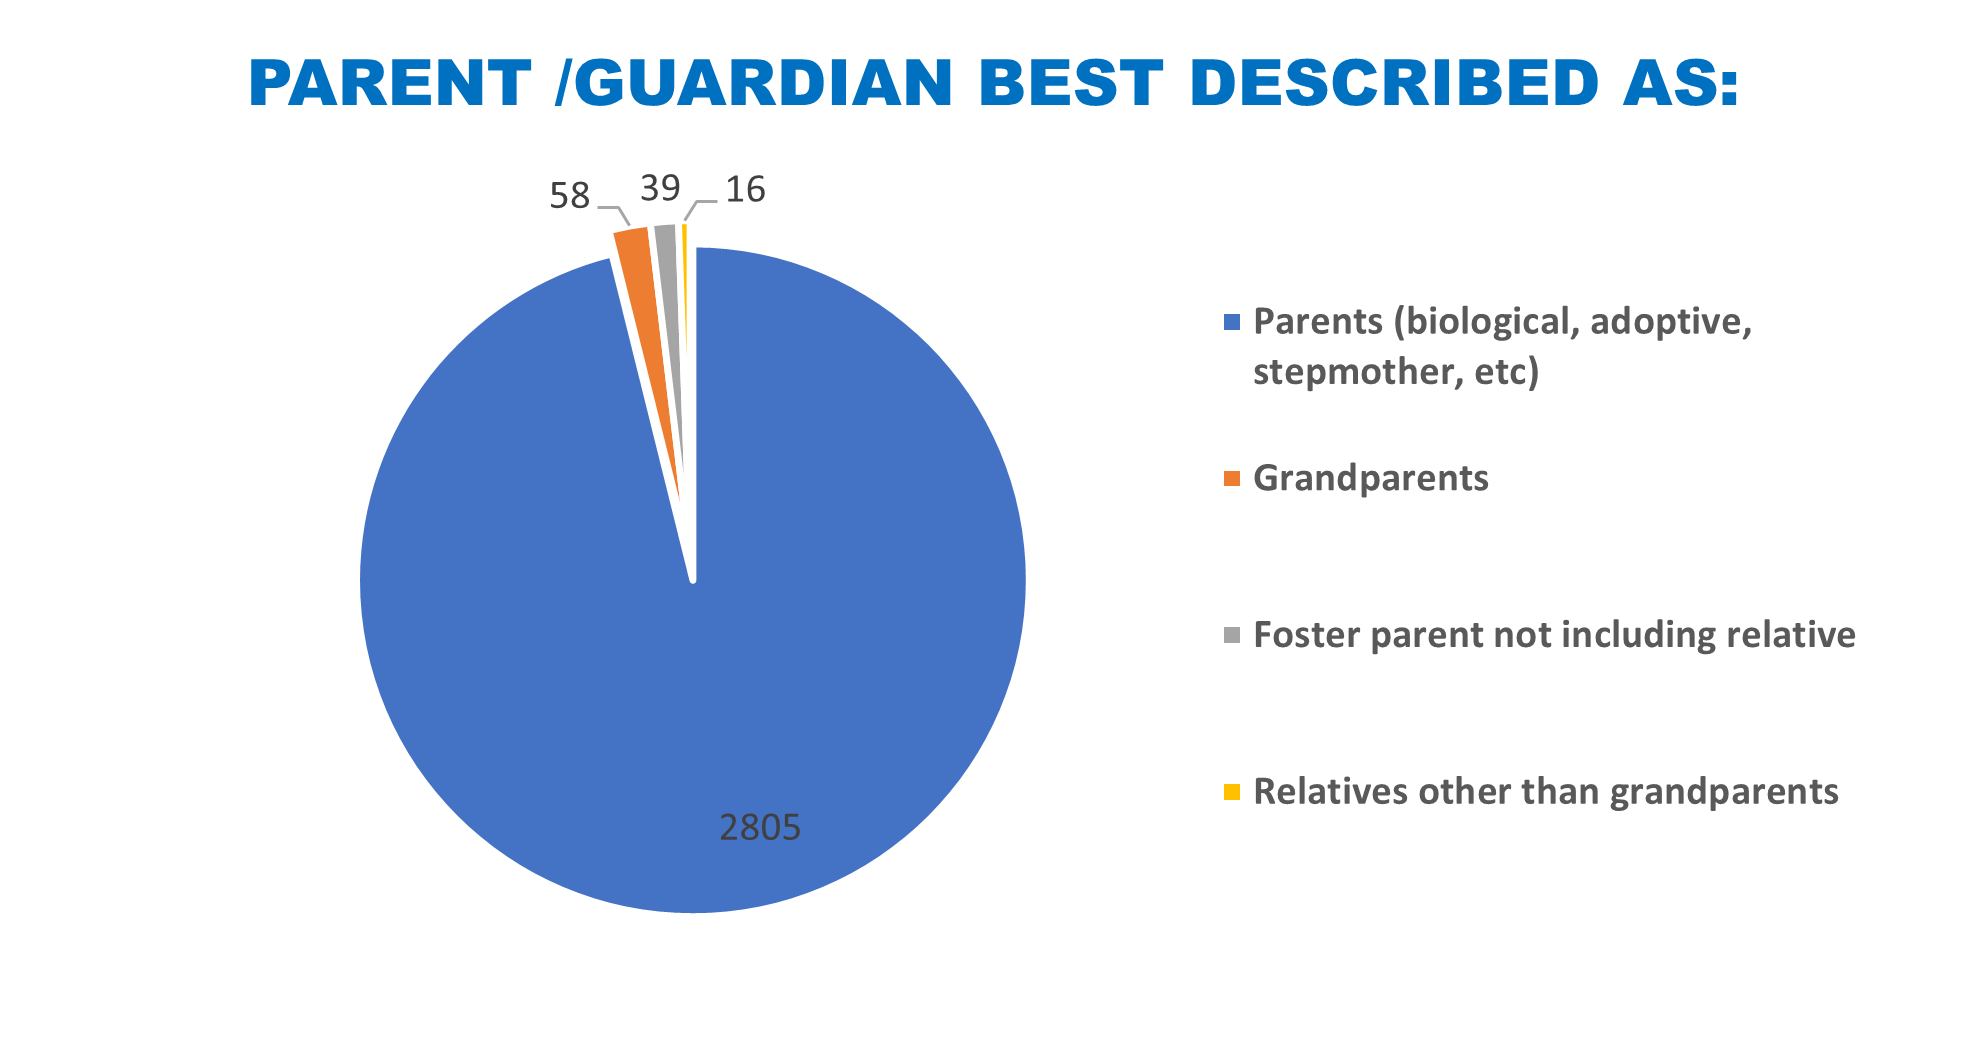
Households

633 Two-Parent Families

2285 Single-Parent Families
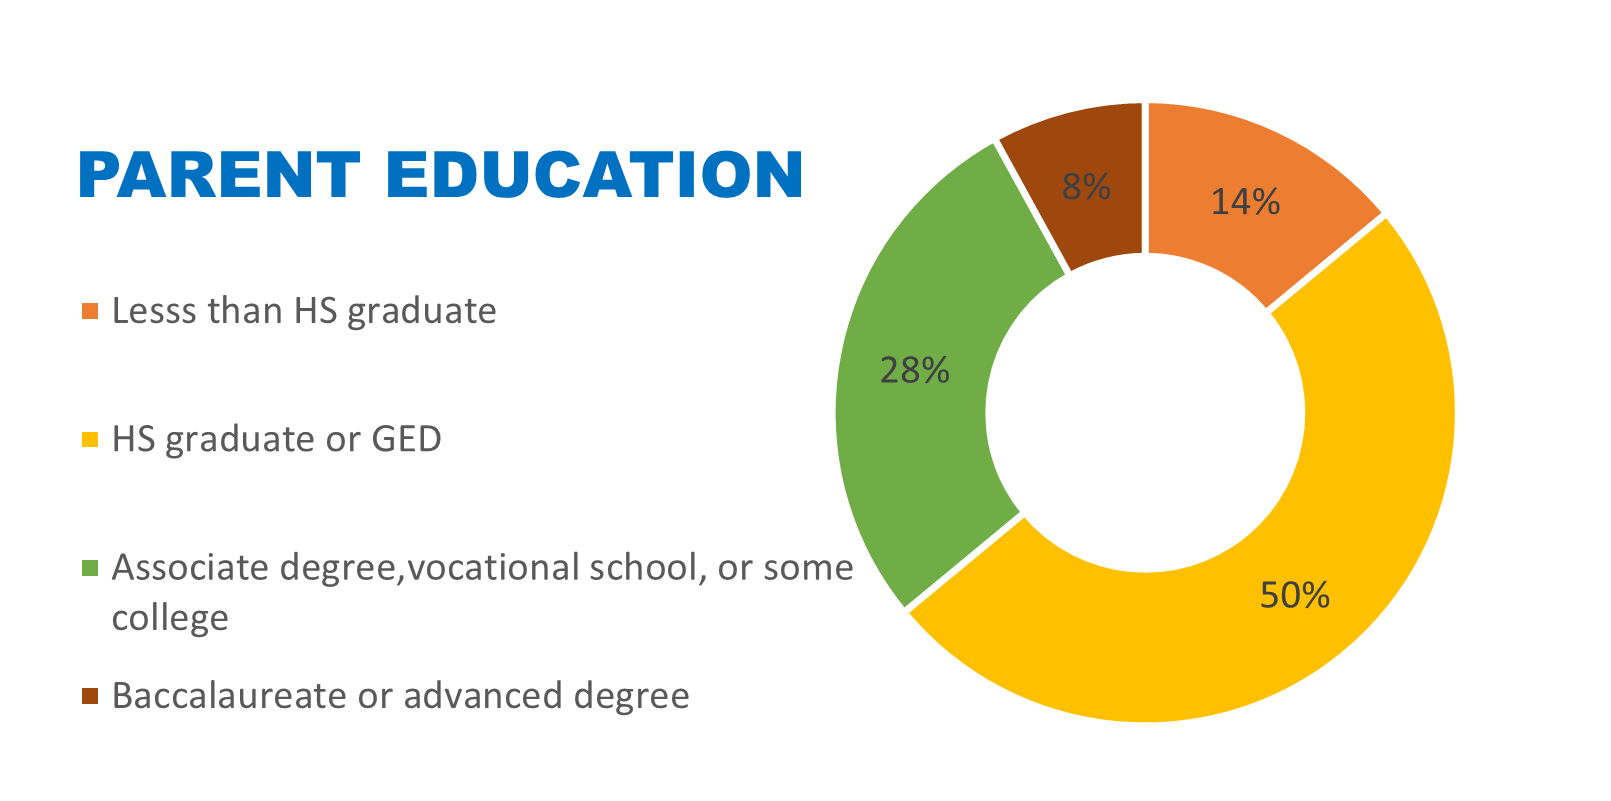
Parent Education
Highest level of education obtained by child’s parent(s) or guardian (s):
Volunteers
Of the agency volunteers for the program year in the 13 County Program, 1,593 were current or former Head Start Parents. This was 55% of the entire number of volunteers.

Parent Listed As In School Or Training
2,683 parents in Thirteen County participated in parenting education sessions
63% of parents participated in the STEP Parent Path program.
0% parent completed a grade level in high school during the program year.
8% of the families did participate in some type of job training and
1% parents were involved in adult education such as GED or other classes.
3% were in English as Second Language training
2% family in marriage education.
41% of families participated in Asset Building or Financial Literacy classes
Parent Testimonial

2022-2023 AUDIT STATEMENT AND BUDGET
 AUDIT
AUDIT
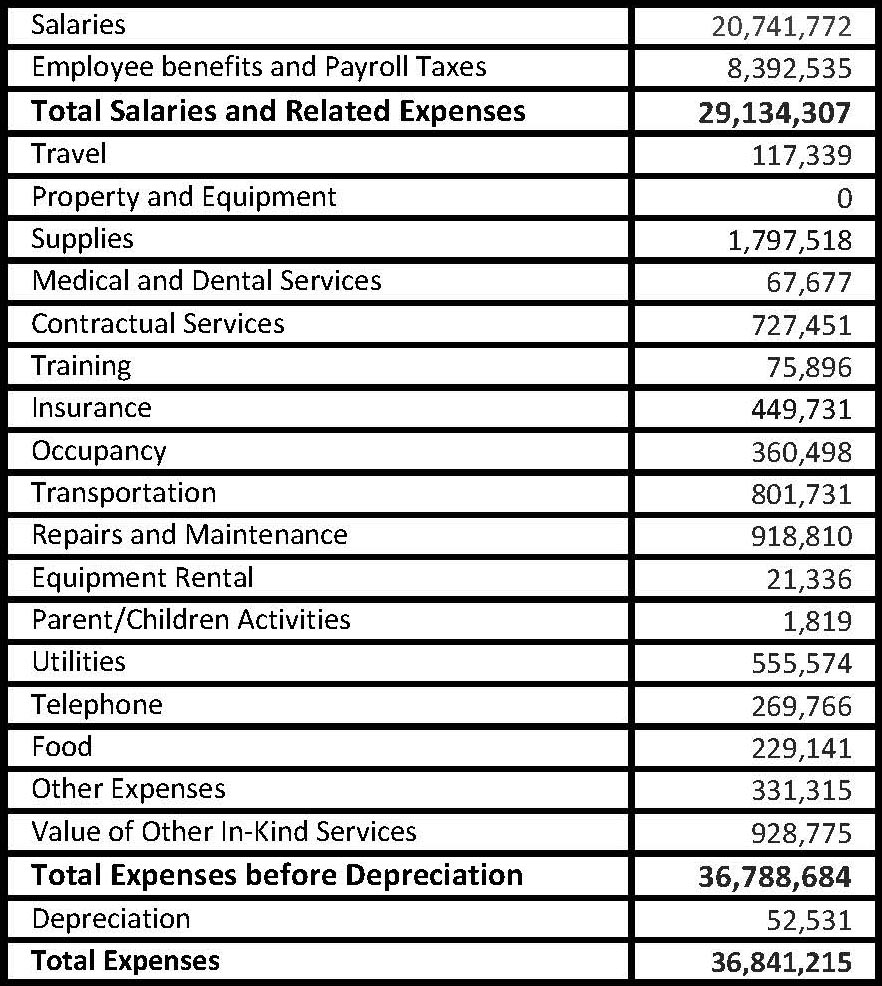
The Institute of Community Services, Inc. financial statement was prepared by ICS Fiscal staff and audited by an independent accounting firm. The financial statement present fairly in all material respects the financial positions of the Institute of Community Services, Inc. as of January 31, 2023.
The annual audit was conducted in accordance with General Accepted Accounting Principles (GAAP) and as required by Title 2 U.S. Code of Federal Regulations Part 200.
The statement of financial positions, activities, functional expenses, and cash flows are all an integral part of these financial statements.
Frances Reola Young
Chief Financial Officer
Head Start Program
ICS, Inc. 13 Counties
January 31, 2023 Expenses
Proposed Budget January 31, 2024
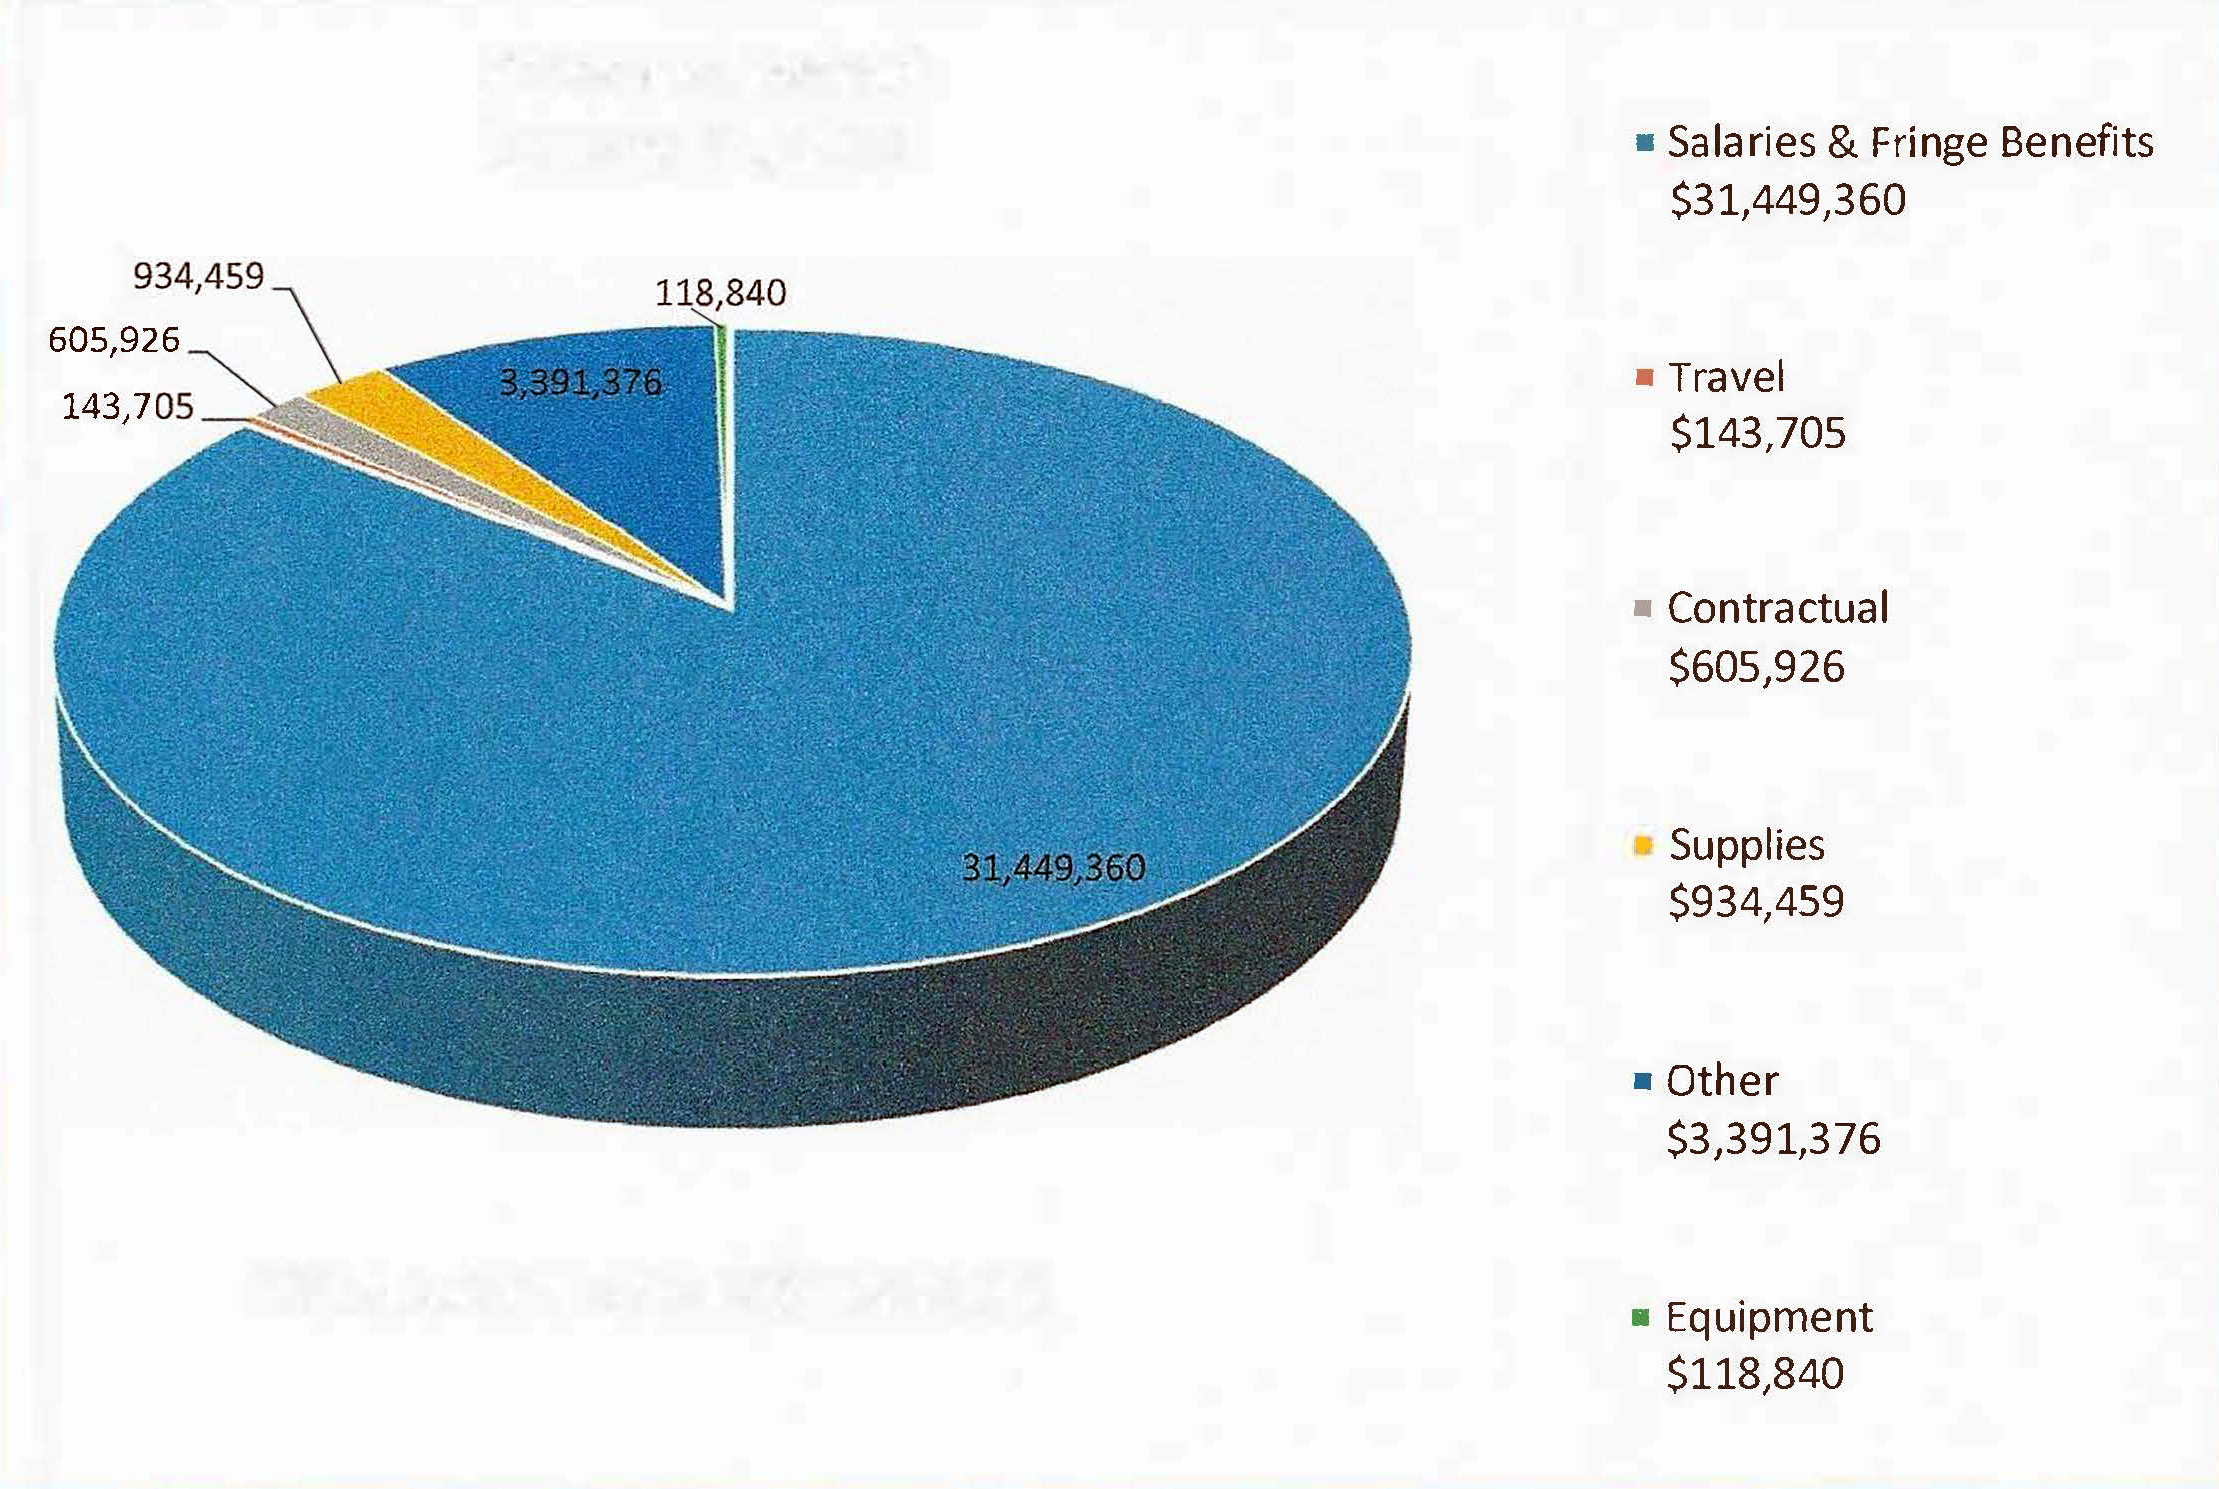
Total Grant Award $36,643,666

View and Download the 13-County Report in English
View and Download the 13-County Report in Spanish